
Financial Price Change Distributions
Distribution of daily percentage price changes for the Russell 2000 stock market index
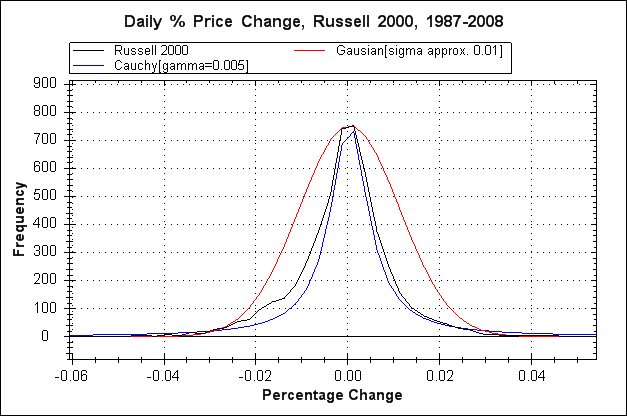
The red plot is a Gaussian distribution based on a standard deviation calculated from the data; We can see that the overall shape does not fit the data (black plot). This distinction lies at the heart of a major failing in the maths of financial risk in the latter half of the 20th century up to the present time, culminating in dangerously flawed risk models such as that employed by the Black-Scholes option pricing formula, and more broadly in the insufficiencies inherent in models such as Value At Risk (VaR). The most striking fact is that the flaw in these models is trivially simple to discover as demonstrated by the above plot. Despite this Black-Scholes has remained in use since its inception in 1973 although some variations are in use that attempt to partially correct the underlying problems.
Arguably (and I would argue this strongly) use of flawed risk models has greatly increased global financial systemic risk and contributed significantly to the rise in the number of financial 'episodes' in recent years such as the stock market crashes of 1987, 1997/98 and 2008. The collapse of LTCM in '98 is of particular note as LTCM justified the use of large leverage ratios on the basis that the risk was hedged (mitigated) by their 'advanced' risk models (in a nutshell the spreading of risk and cancelling out of risk in one area with investments in another). Myron Scholes and Robert Merton of Black-Scholes fame were on the LTCM board of directors and the flaws in the Black-Scholes formula lay at the heart of LTCM's risk models. Initially LTCM was very successful but collapsed following the Asian financial crisis of '97 and the subsequent Russian crisis of '98. LTCM's models had grossly underestimated the probability of such events, and essentially this was through lack of understanding of the above distribution plot (or perhaps the failure to draw the plot at all?).
Why had this seemingly trivial to discover fact been overlooked? Part of the problem was perhaps a paucity of data and computing resources. In order to get a clear picture of a price change distribution a suitably long stretch of prices is required, otherwise the obtained curve may be peculiar to a shorter time span. Further, to process a long stretch of data requires some modest computing resource. Both the data and the computing resource were available in 1973 when Black-Scholes was devised and could reasonably have been acquired, albeit at some effort as personal computing was only just emerging in the early 70's, however, the required computing resources would have been available at most universities.
Ten years previously in 1963 Benoit Mandelbrot had drawn from the work of others and highlighted the issue of financial price series having non-Gaussian distributions when he analysed cotton price records from the New York Cotton Exchange going back to 1900 (see The Variation of Certain Speculative Prices). This work was facilitated by Mandelbrot's access to computing resources through his research position at IBM's Thomas J. Watson Research Center. It's possible that such research was overlooked or dismissed by simply assuming that cotton prices have no bearing on company share prices.
Apart from an overall difference in shape between the Gaussian plot and the raw data plot the most important difference is less obvious, and that is out on the extreme ends of the tails, here's a graph that zooms in on the left hand tail.
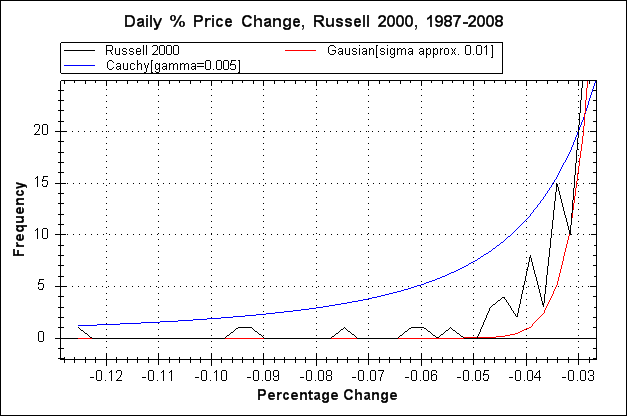
Here we can more clearly see the central issue with the Gaussian distribution. The bumps to the far left in the raw data (black line) represent the occurrence of extremely improbable events if we are taking the data to be Gaussian. The Gaussian distribution basically indicates that large price movements will probably not happen in the lifetime of the universe let alone the next few years or decades, hence the likes of LTCM felt confident in making trades based on such predictions. This same misunderstanding underlies the idea that stock market crashes are a once in a 100 year event (or some similarly long period), such an idea derives from the standard deviation measured from the data and using the SD to calculate the probabilities of large price movements based on a Gaussian distribution curve. Of course, multiple improbable stock market crashes in a relatively short period of time of 30 years or so would not be impossible even if price changes were Gaussian, but such a series of crashes would be highly improbable to the extent that one must seriously question the underlying assumption of Gaussianity.
Colin,
(some time in 2008)
 Copyright 2008-2016 Colin
Green.
Copyright 2008-2016 Colin
Green.This article is licensed under a Creative Commons Attribution 3.0 License